See where every hour really goes.
TimeStudy runs your whole time study in one platform. Your people answer a short survey against your own process Taxonomy. Your leaders get 40+ standard KPIs on where effort and cost sit, and which work is ready for automation and AI.
- No logins · personal survey links
- 40+ standard KPIs
- Results in as little as two weeks
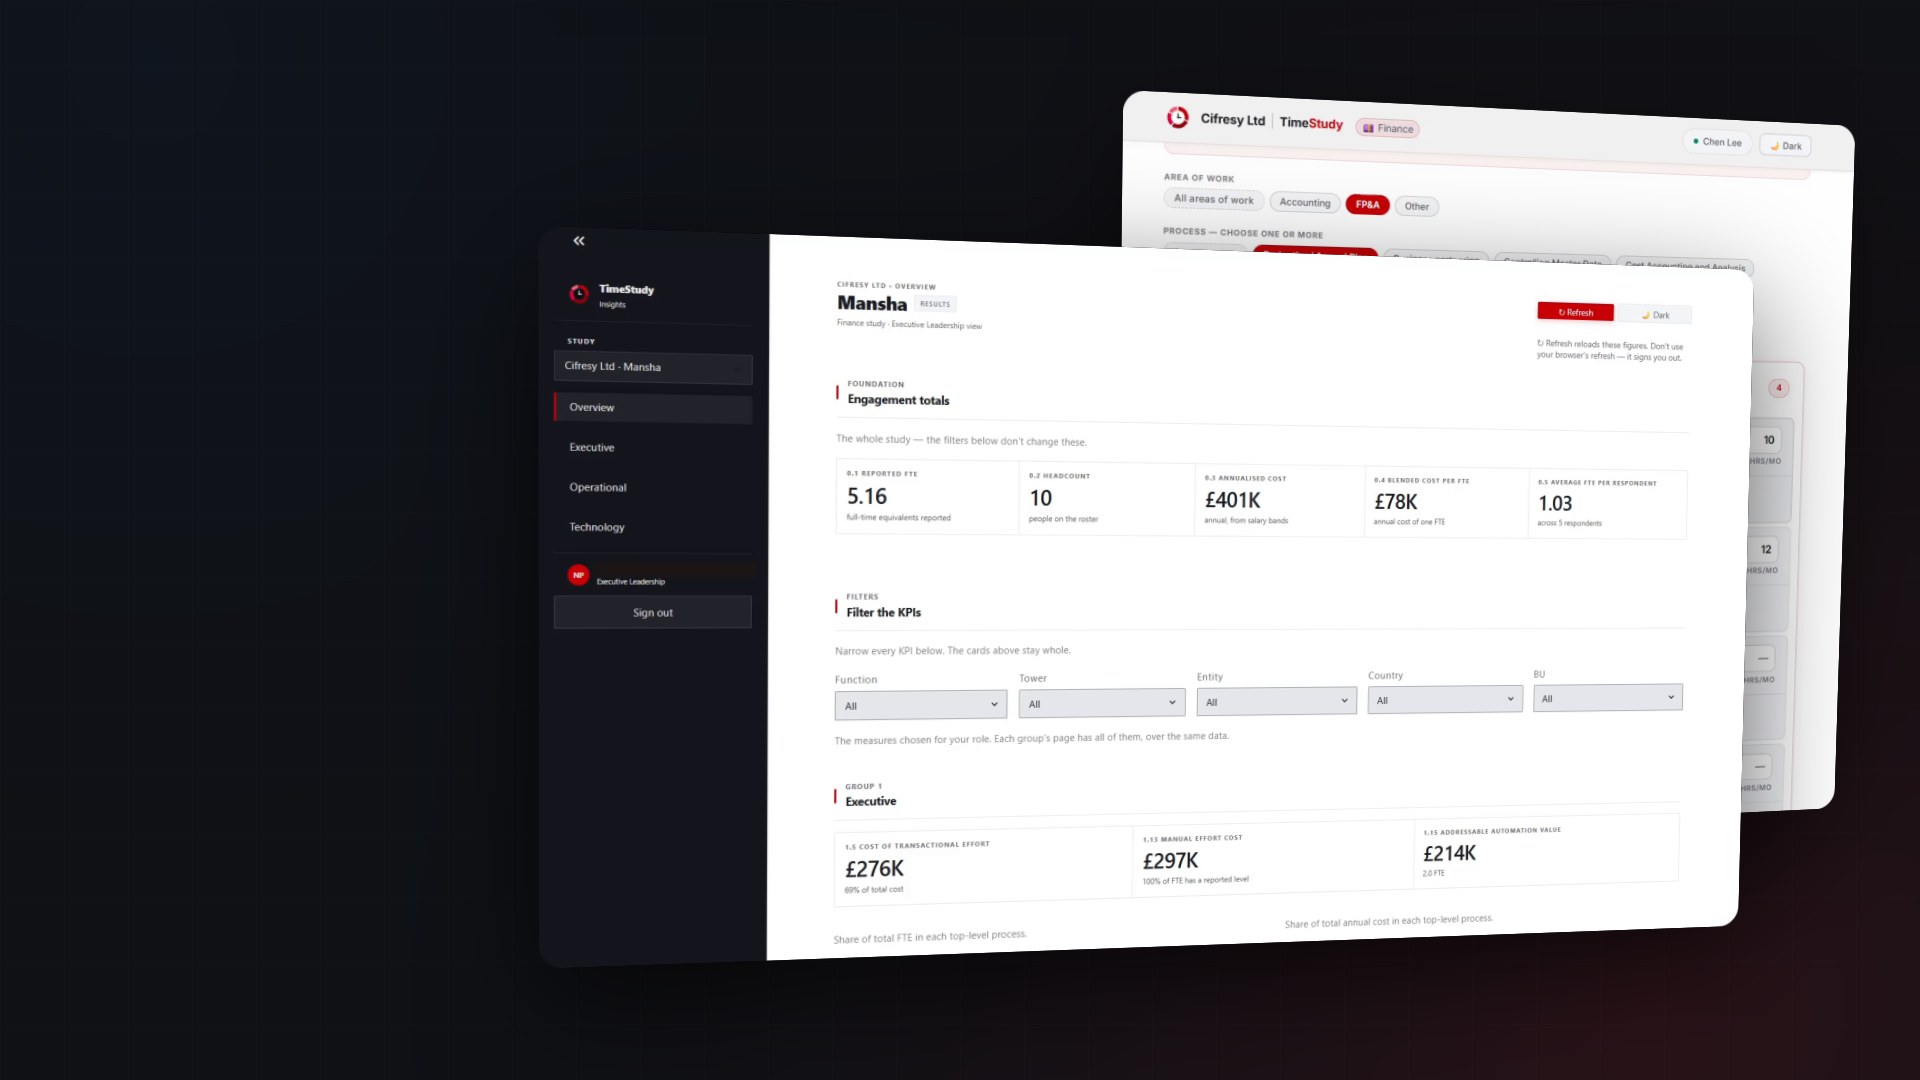
Time becomes insight.
Most leaders can only guess where the hours go.
Finding out usually means a consulting project. By the time the answer arrives, the organisation has already moved on.
- 01InterviewsHours of meetings to ask people what they do.
- 02Spreadsheets by emailtimesheet_v7_FINAL.xlsx, and every version after it.
- 03Weeks of pivot tablesManual analysis before anyone can make a decision.
Out of date by the time it lands
Three simple steps.
Set up
Load your process Taxonomy, staff list and salary bands in the Admin Portal. Send invitations and reminders, and watch responses arrive live.
Survey
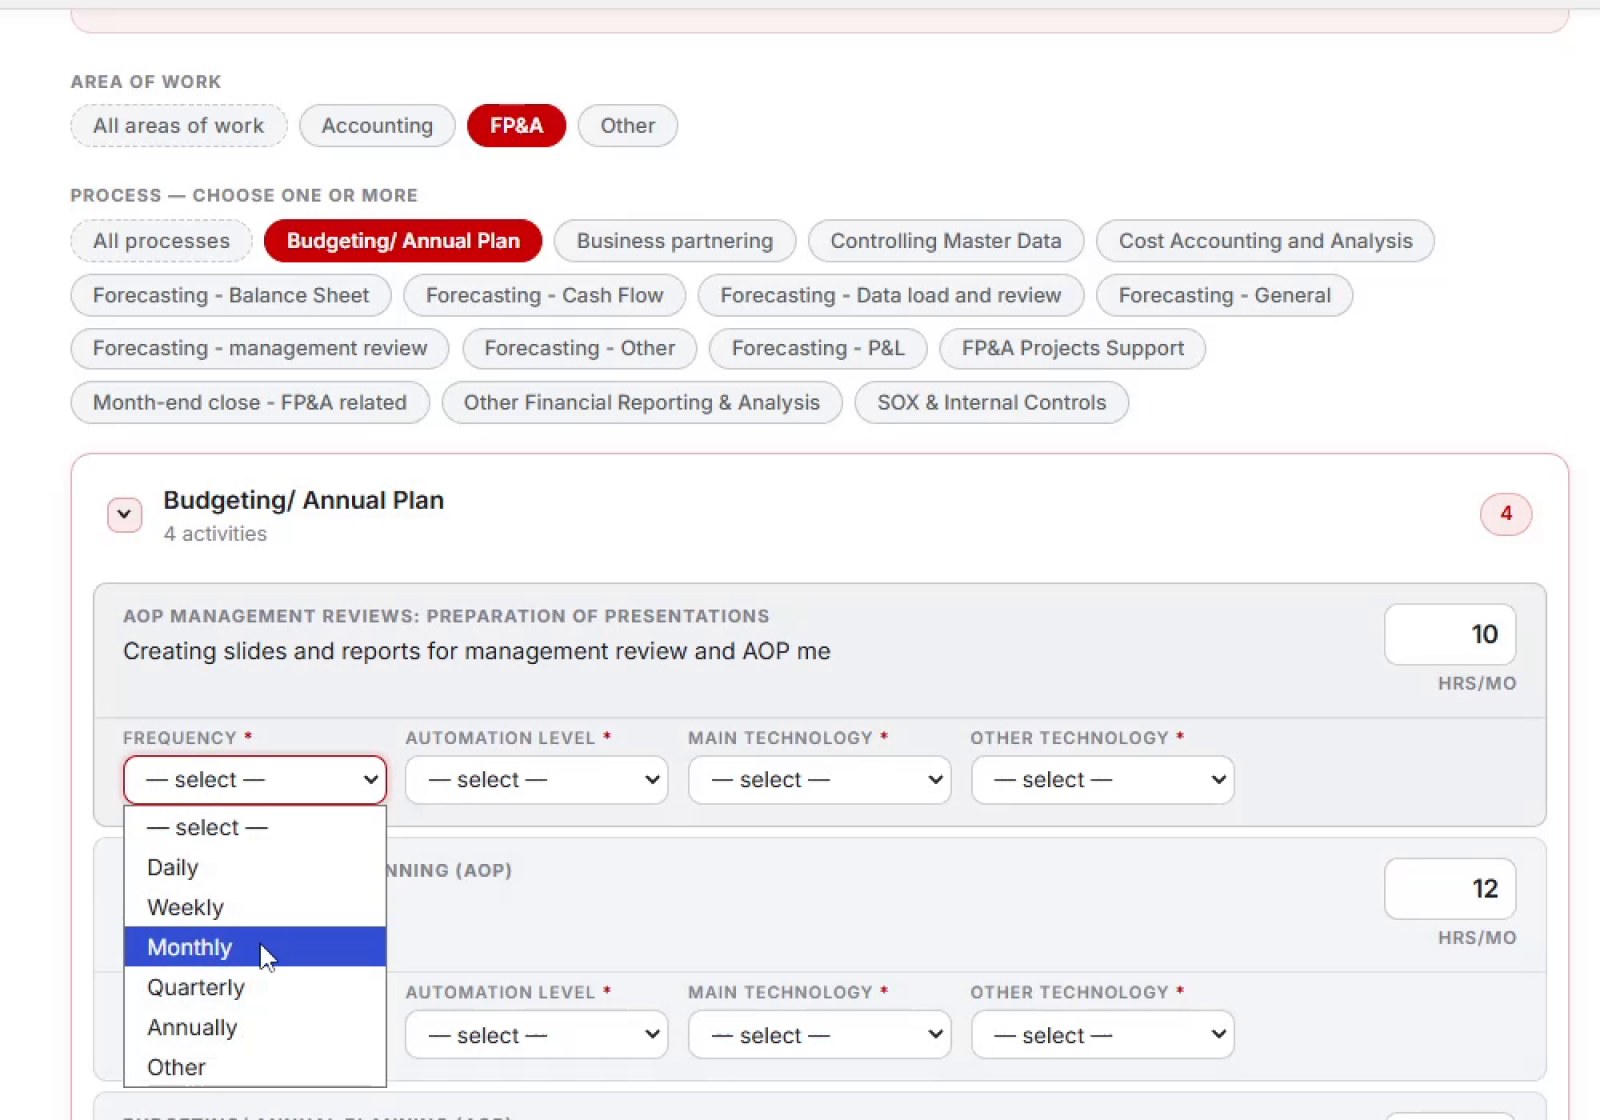
Each person gets a personal link with no login or password. They enter hours against your own activities, down to level 4, and can save and come back.
Insights
40+ standard KPIs are calculated automatically, with the right view for each leader and an AI assistant for questions in plain English.
A survey anyone can finish.
No accounts, no spreadsheets. People see your organisation’s own process Taxonomy and fill in what they actually do.
- Personal link, no login or password
- Hours per month against each activity, down to level 4
- Frequency, automation level and tools used
- Progress saves, so people can come back any time
- Your logo and colour on the survey, if you want them
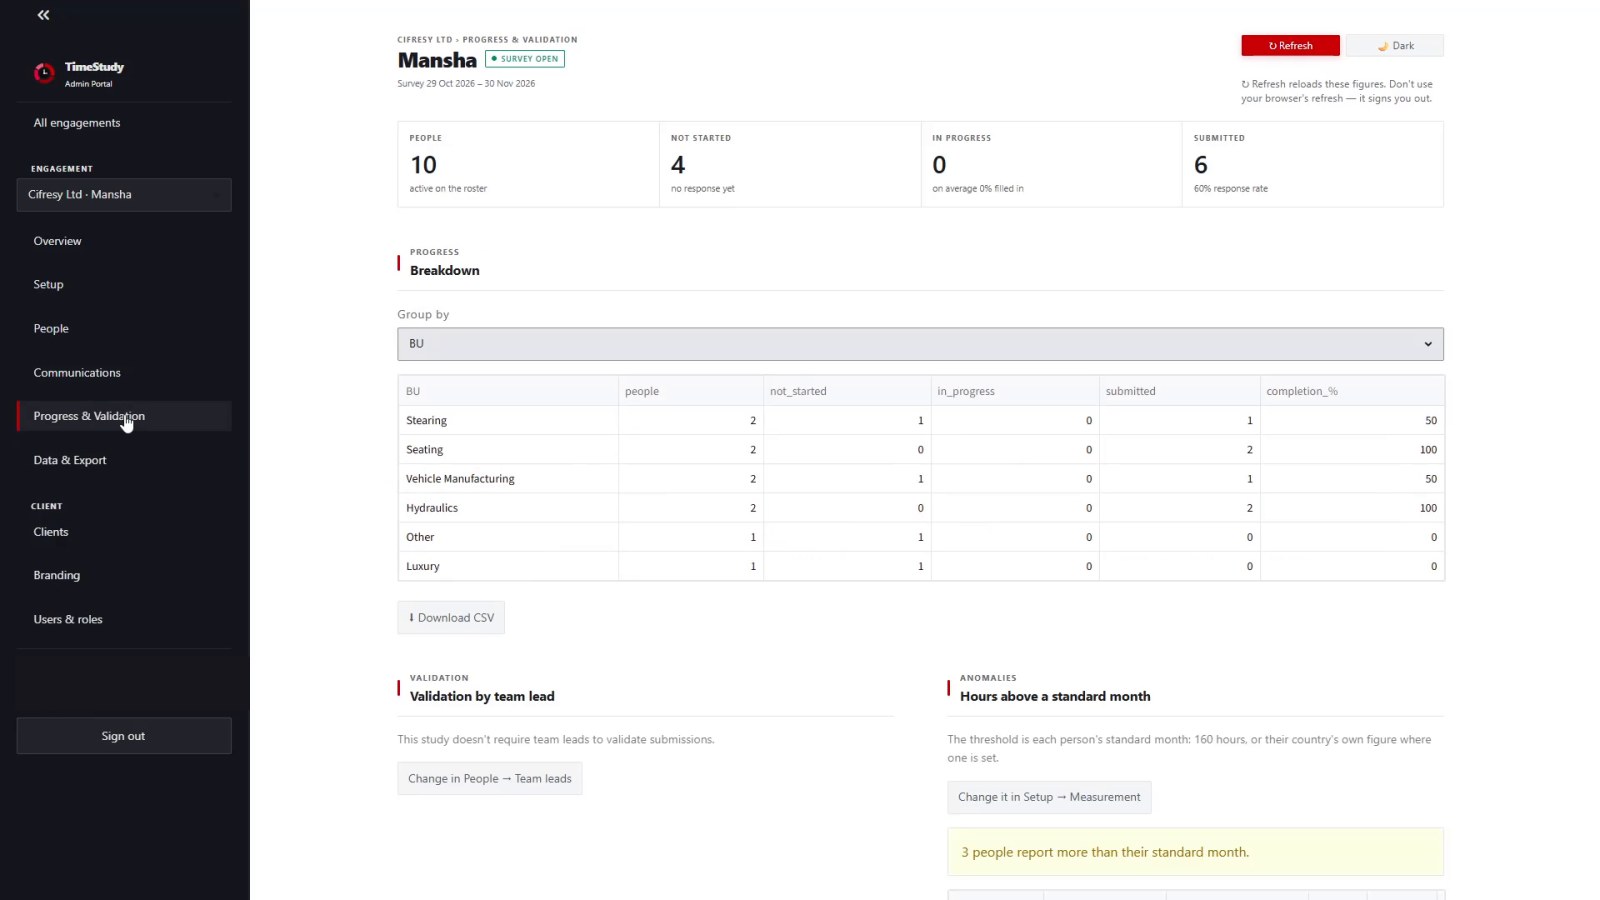
Your project team stays in control.
Set up the study, follow progress and check the numbers before anything is published.
- Process Taxonomy, staff list, salary bands and survey questions
- Invitations and reminders sent from the portal
- Response rates live, by business unit or team
- Team leads check their people’s hours
- A built-in check that reported effort adds up
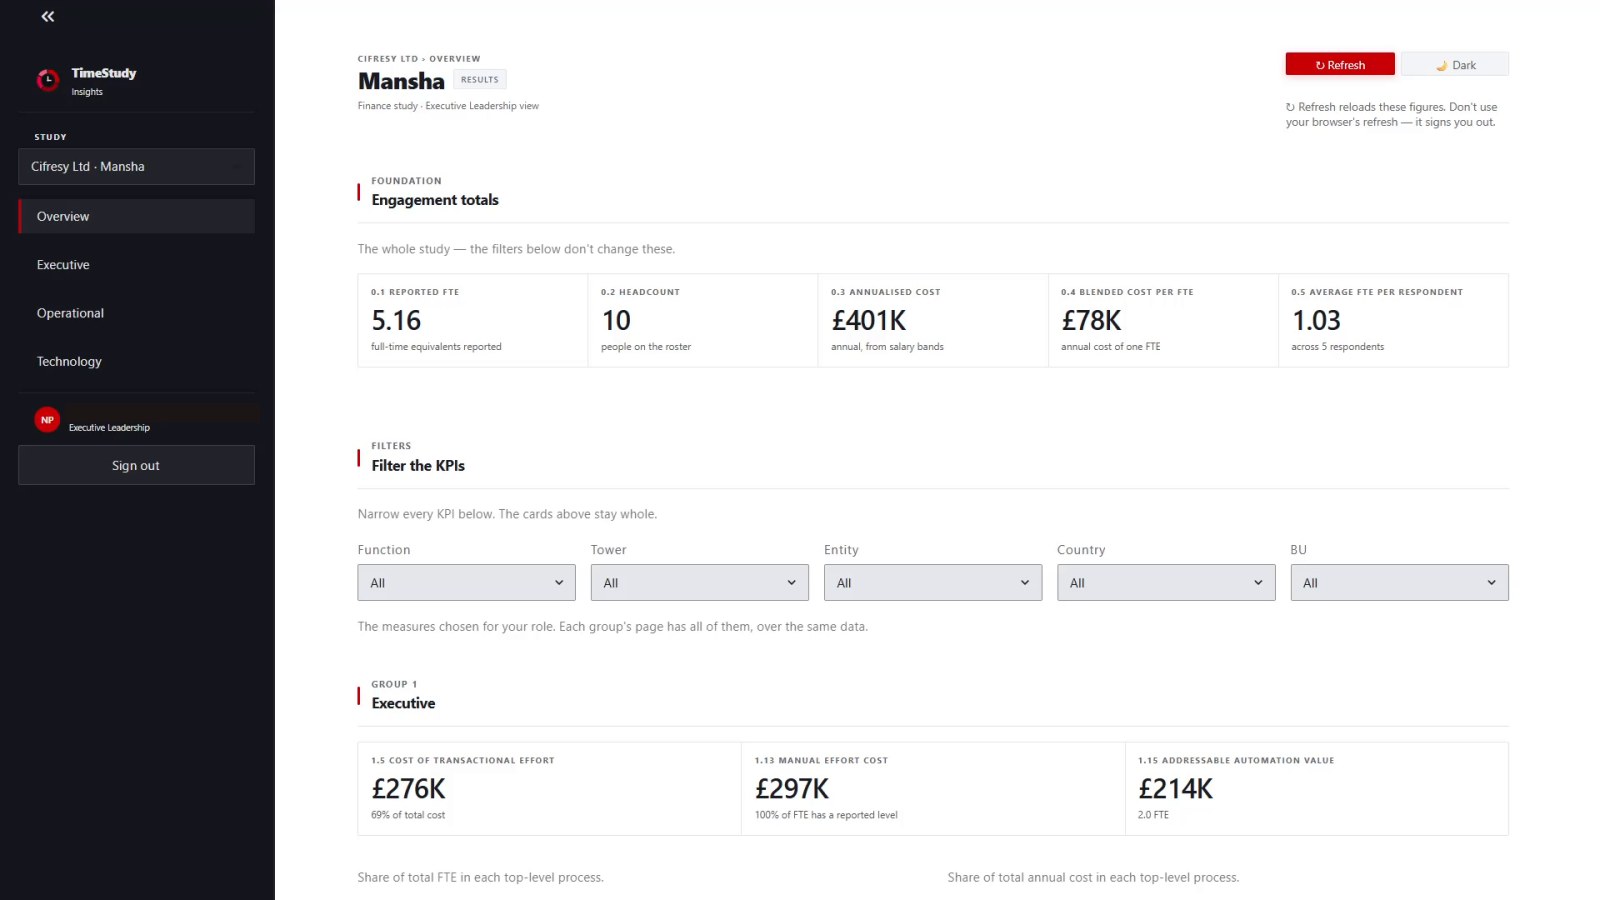
40+ standard KPIs, calculated automatically.
Executive, Operational and Technology pages show where effort and cost really sit, with no pivot tables. Export any page as a PDF.
- Effort and cost by process
- Transactional vs strategic
- Manual effort cost
- Effort concentration
- Process replication
- Tooling fragmentation
- Cost per invoice, hire or ticket
Know which work to automate first.
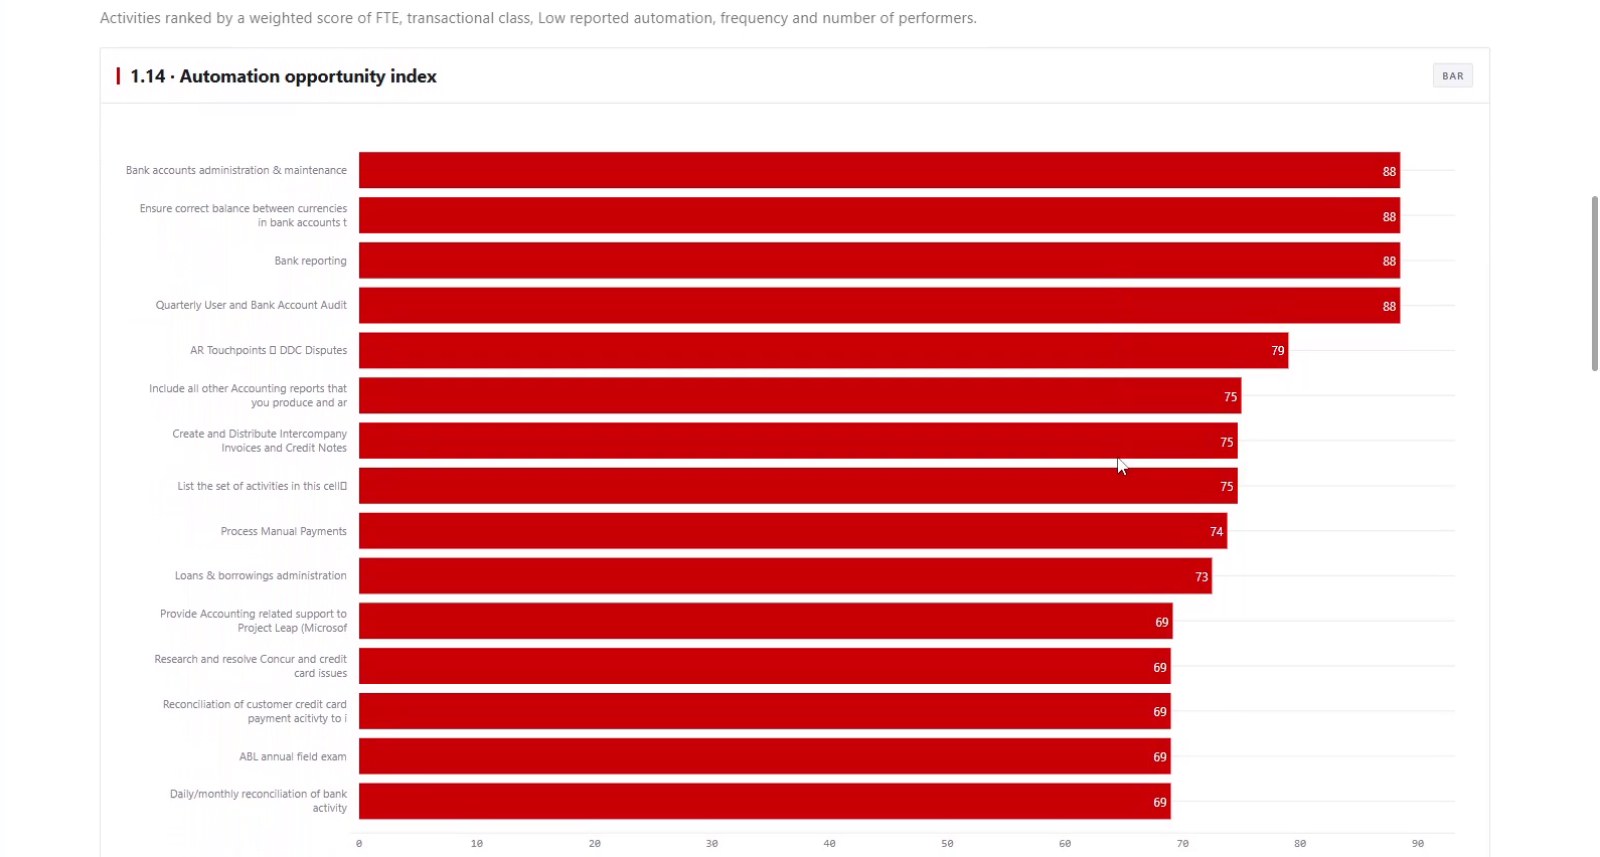
The automation opportunity index ranks activities by effort, transactional work, reported automation, frequency and number of people doing them. So you can see where automation, AI or process improvement will pay back first.
- Ranked list of automation candidates
- Where to automate, standardise or reorganise
- Ask TimeStudy AI questions in plain English
Everyone sees what’s theirs.
Four audiences, each scoped to their own area and compared with the whole study.
The whole organisation
Every function, tower and team in one view.
Their towers
Their area, set against the full study.
Their teams
Where their teams’ time and cost go.
Their people
Validate hours and see their team’s mix of work.
- Finance
- HR
- Procurement
- IT
- Operations
- Supply Chain
- Legal
- Customer Service
- Shared Services
Insight without exposing individuals.
Salary bands, never salaries
Every hour is costed from salary bands. Individual salaries are never used.
Access by role
Cost can be hidden from a role, and groups below a minimum size are never shown.
Summarised data for AI
TimeStudy AI only works on summarised figures, and only within what that person is allowed to see.
Each client kept separate
Every client’s study is kept separate, hosted on Microsoft Azure.
Frequently asked.
How long does a time study take?
The whole process can take as little as two weeks, from setting up the study to results in Insights. Timing depends on the size of the study and how quickly people complete the survey.
Do employees need an account?
No. Each person gets a personal survey link, with no account or password. Progress saves, so they can come back to it.
Can we use our own process Taxonomy?
Yes. The survey uses your organisation’s own process Taxonomy, down to level 4 activities, and questions can be switched on, off, required or optional for each study.
Which teams can it cover?
Finance, HR, Procurement, IT, Operations, Supply Chain, Legal, Customer Service and Shared Services. Studies typically cover 100 to 1,000 people.
How is TimeStudy priced?
TimeStudy is sold per study through Pivotix. Book a demo and we’ll scope it with you.
See TimeStudy on your own process Taxonomy.
Book a demo and we’ll walk through the survey, the Admin Portal and Insights with you.
Or email info@pivotix.pro